Do collaborations make songs more popular on Spotify?

Measuring the featured-artist effect with proper statistical controls — and catching two of my own overclaims along the way. An independent reconstruction and extension of a COGS 108 (UC San Diego) team project.

n = 89,740 tracks OLS + HC3 robust SEs Genre fixed effects Effect sizes + 95% CIs

Circular Spotify logo rendered as a disco ball
01 · The Objective

The headline finding, up front

Featured tracks look more popular than solo tracks on Spotify (p ≈ 1e-26). This project shows the gap is real but tiny, and that almost all of it comes from genre — not from collaboration itself.

+1.4
points, raw gap (0–100 scale)
featured minus solo
d ≈ 0.07
Cohen's d
the two distributions overlap almost completely
99%
of the raw gap is genre composition
not a collaboration premium
+0.28
adjusted effect, controls + genre FE
95% CI −0.01 to +0.57, p = 0.06
Research question

Do tracks featuring at least one other artist have higher Spotify popularity than solo tracks, controlling for duration, explicitness, and the audio features energy and danceability — and, in the fuller specification, valence, loudness, and genre?

02 · Dataset Overview

What "featured" looks like in practice

A "featured" track lists another artist in its credits or title (e.g. "feat. Name"); a "solo" track does not. These aren't rows from the analysis sample — they're familiar catalog examples to make the definition concrete.

Sprinter album art
Sprinter
Dave & Central Cee
has_feature = 1
Funk Wav Bounces Vol. 1 album art
Funk Wav Bounces Vol. 1
Calvin Harris
mostly features
Thriller album art
Thriller
Michael Jackson
has_feature = 0
25 album art
25
Adele
has_feature = 0
Views album art
Views
Drake
has_feature = 0
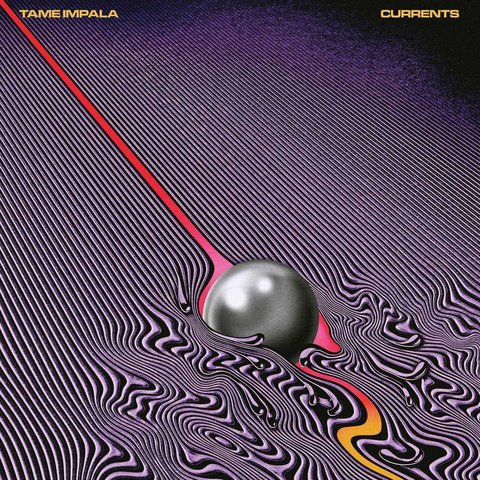
Currents album art
Currents
Tame Impala
has_feature = 0
Eternal Sunshine album art
Eternal Sunshine
Ariana Grande
has_feature = 0
Blue Water Road album art
Blue Water Road
Kehlani
has_feature = 0
Dopamine album art
Dopamine
Lil Tecca
has_feature = 0
Come Home The Kids Miss You album art
Come Home The Kids Miss You
Jack Harlow
has_feature = 0
Do I Clench My Fists album art
Do I Clench My Fists
Ridgeclub
has_feature = 0

Source

Spotify Tracks Dataset (maharshipandya, via Kaggle/Hugging Face) — 114,000 track–genre rows with Spotify's popularity score, audio features, and track_genre. Deduplicated deterministically by track_id.

Key variables

  • Outcome — popularity (0–100)
  • Predictor — has_feature (multi-artist credit or title marker)
  • Controls — duration, explicit, energy, danceability, valence, loudness, genre
03 · Data Cleaning Pipeline

From 114,000 rows to 89,740 tracks

STEP 1

Deduplicate

Drop duplicates by track_id — deterministic, reproducible.

STEP 2

Fix duration

Convert duration_ms → duration_sec; drop tracks with duration = 0.

STEP 3

Flag explicit

Cast the explicit flag to a clean 0/1 integer.

STEP 4

Detect features

has_feature = 1 if multiple artists are credited (;-separated) or the title contains "feat.", "ft.", "featuring", or "with" as a whole word.

Fingerprint check

The original team's processed files were lost after the course ended. This dataset was re-identified by matching summary statistics from the final presentation: 89,740 unique tracks; explicit split 82,036/7,704; group means 32.81/34.26. This rebuild reproduces every one of those numbers to within one row.

04 · Exploratory Data Analysis

Popularity is skewed and zero-inflated

A large share of tracks sit at exactly 0 popularity — low or no recent engagement. That shapes every test downstream: a rank-based test instead of a t-test, and a dedicated robustness check that excludes the zero spike.

Distributions of the outcome (popularity) and key controls (duration, energy, danceability). Hover any bar or axis label for details. Generated directly from the executed analysis notebook's data.
05 · Featured vs. Solo

The original analysis, reproduced — plus the effect sizes it omitted

Mann–Whitney U test (popularity is non-normal), plus rank-biserial r and Cohen's d, which the original presentation never reported.

Featured tracks sit slightly higher — but "slightly" is doing a lot of work here. Hover the bars or the boxes for exact values.
+1.41
raw difference in means
95% CI [+1.09, +1.73]
p ≈ 4.2e-26
Mann–Whitney U, one-sided
essentially guaranteed at n ≈ 90k
r = 0.046
rank-biserial correlation
tiny
d = 0.069
Cohen's d
distributions overlap ~97%
06 · The Regression Our Proposal Specified

Completing the plan the final presentation never delivered

The project proposal planned an OLS regression with HC3 robust standard errors, a 95% CI, a p-value, and a standardized effect size — with genre among the controls. The final presentation stopped at the bivariate comparison above. This section completes it.

SpecificationCoefficient95% CIp
Raw difference in means+1.41[+1.10, +1.72]≈1e-26 (M–W)
Spec 1: duration + explicit + energy + danceability+1.08[+0.76, +1.40]4e-110.007
Spec 2: + valence + loudness + genre fixed effects+0.28[−0.01, +0.57]0.0620.329
Diagnostics

Variance inflation factors across all Spec 2 predictors stay below 2.6 — well under the conventional threshold of 5. Multicollinearity is not driving the shrinkage.

07 · Why The Effect Shrinks

Genre composition, not a collaboration premium

Genre fixed effects take R² from ~0.01 to ~0.33 and cut the featured-artist coefficient by roughly three quarters. An exact shift-share decomposition splits the raw gap into genre composition and the within-genre gap — the two terms sum to the raw gap with no residual, by construction.

Left: the raw +1.41 gap decomposed. Right: every genre plotted by featured-track share vs. mean popularity, bubble size = track count — hover a bubble for the genre name. Collaborations concentrate in genres (dancehall, hip-hop, reggaeton) that are already more popular.
A second self-caught error

The first version of this decomposition compared each group's genre exposure to a blended genre-level mean, mixing featured and solo tracks together. That's a natural thing to write — but it's not algebraically correct: the two components didn't sum back to the raw gap, landing about 0.4 points short, because the blended mean already absorbs part of the within-genre effect it's supposed to be separate from. A regression test written for this rebuild (test_genre_decomposition_sums_to_raw_gap) catches exactly this. The fix, a proper shift-share decomposition, moves genre composition's share of the gap from an approximate 73% to an exact 99%. The within-genre conclusion — effectively zero — is unchanged either way.

08 · Robustness

Same story, four different ways of counting "featured"

Alternate detection rules, excluding the popularity = 0 spike, and excluding remix/live/acoustic/remaster versions — the adjusted effect stays between roughly zero and half a point every time.

The estimated effect shrinks toward zero as controls improve, and stays there under every alternative sample definition. Hover any point for its estimate and 95% CI.
09 · What Changed

Statistically significant ≠ practically significant

The original computation was correct. The conclusion drawn from it was stronger than the evidence supported.

Original presentation
“Featured artists meaningfully boost visibility and popularity on Spotify… collaborations strategically elevate track success.”

Based on p ≈ 1e-29 alone — without ever reporting an effect size.

This reconstruction
The raw gap is real but tiny (+1.4 points, d ≈ 0.07). 99% of it is genre composition. Controlling for genre and audio features, the adjusted effect is +0.28 points — between roughly zero and half a point across every robustness check.

At n ≈ 90,000, statistical significance is nearly guaranteed for any nonzero difference. The analytical question was always effect size.

Why this differs from stream-based studies reporting ≥5% more streams for collaborations

Different outcome (Spotify's recency-weighted popularity score, not stream counts); different sample (a broad catalog snapshot, not new chart releases); and unobserved artist fame — which biases this estimate upward if anything, since famous artists both collaborate more and are more popular. That the adjusted effect is still near zero makes the null-ish result more credible, not less.

10 · Limitations

What this analysis can't tell you

11 · Credits & Attribution

Sources, artists, and the original team

Data & platform

Analysis built on the Spotify Tracks Dataset (maharshipandya, via Kaggle). Popularity scores, audio features, and the Spotify name/logo are the property of Spotify AB, referenced here for academic, non-commercial commentary on publicly available data.

Spotify

Original team — COGS 108, Group 34

Jose Enrique Siono Gutierrez, Zulema Zermeno, Sahar Zahir, Sonali Singh, Teresa Jia.

This site is an independent reconstruction and extension by Sonali Singh. Original team roles: analysis, background research, visualization, writing (original draft).

Album art shown above

Cover art is used solely to illustrate the has_feature definition and belongs to the respective label/artist. Not used commercially, not modified beyond thumbnail resizing.

Sprinter — Dave & Central Cee
Funk Wav Bounces Vol. 1 — Calvin Harris
Thriller — Michael Jackson
25 — Adele
Views — Drake
Currents — Tame Impala
Eternal Sunshine — Ariana Grande
Blue Water Road — Kehlani
Dopamine — Lil Tecca
Come Home The Kids Miss You — Jack Harlow
Do I Clench My Fists — Ridgeclub